Arrest. Noun, “a stoppage or sudden cessation of motion.” Verb, “seize (someone) by legal authority and take into custody.” Time. Noun, “the indefinite continued progress of existence and events in the past, present, and future regarded as a whole.” Verb, “measure the time taken by (a process or activity, or a person doing it).” — Definitions by Oxford Languages.
Project 1 Final Print Design (11 x 17) — Created using Adobe Illustrator and Flourish
The Assignment, the Story
In my grad school class “Introduction to Info Graphics and Data Visualization,” Prof. Alberto Cairo tasked us with visualizing a story based on the theme of mass incarceration in the US. The assignment entailed reading The New Yorker article “The Caging of America” by Adam Gopnik, January 23, 2012, to help us find an avenue for the story.
Though the article provided many possible stories, I was immediately impressed by the opening, painting the inmates’ relationship with time as a daunting source of despair. And after reading through the full article, I kept going back to time.
For many of us, it sometimes feels as if there is not enough time. There is anxiety and fear of the ever rapidly, wrinkling time and the need for more months in a year, more days in a week and more hours in a day.
For the inmates as expressed in the article, it is painted quite the opposite and to a depth of feeling difficult to fathom—time as a seemingly never ending, torturous expansive entity. Envision the years, months, mornings, afternoons, evenings, nights, hours, minutes, seconds, milliseconds to infinity.
The story is time.
The Data
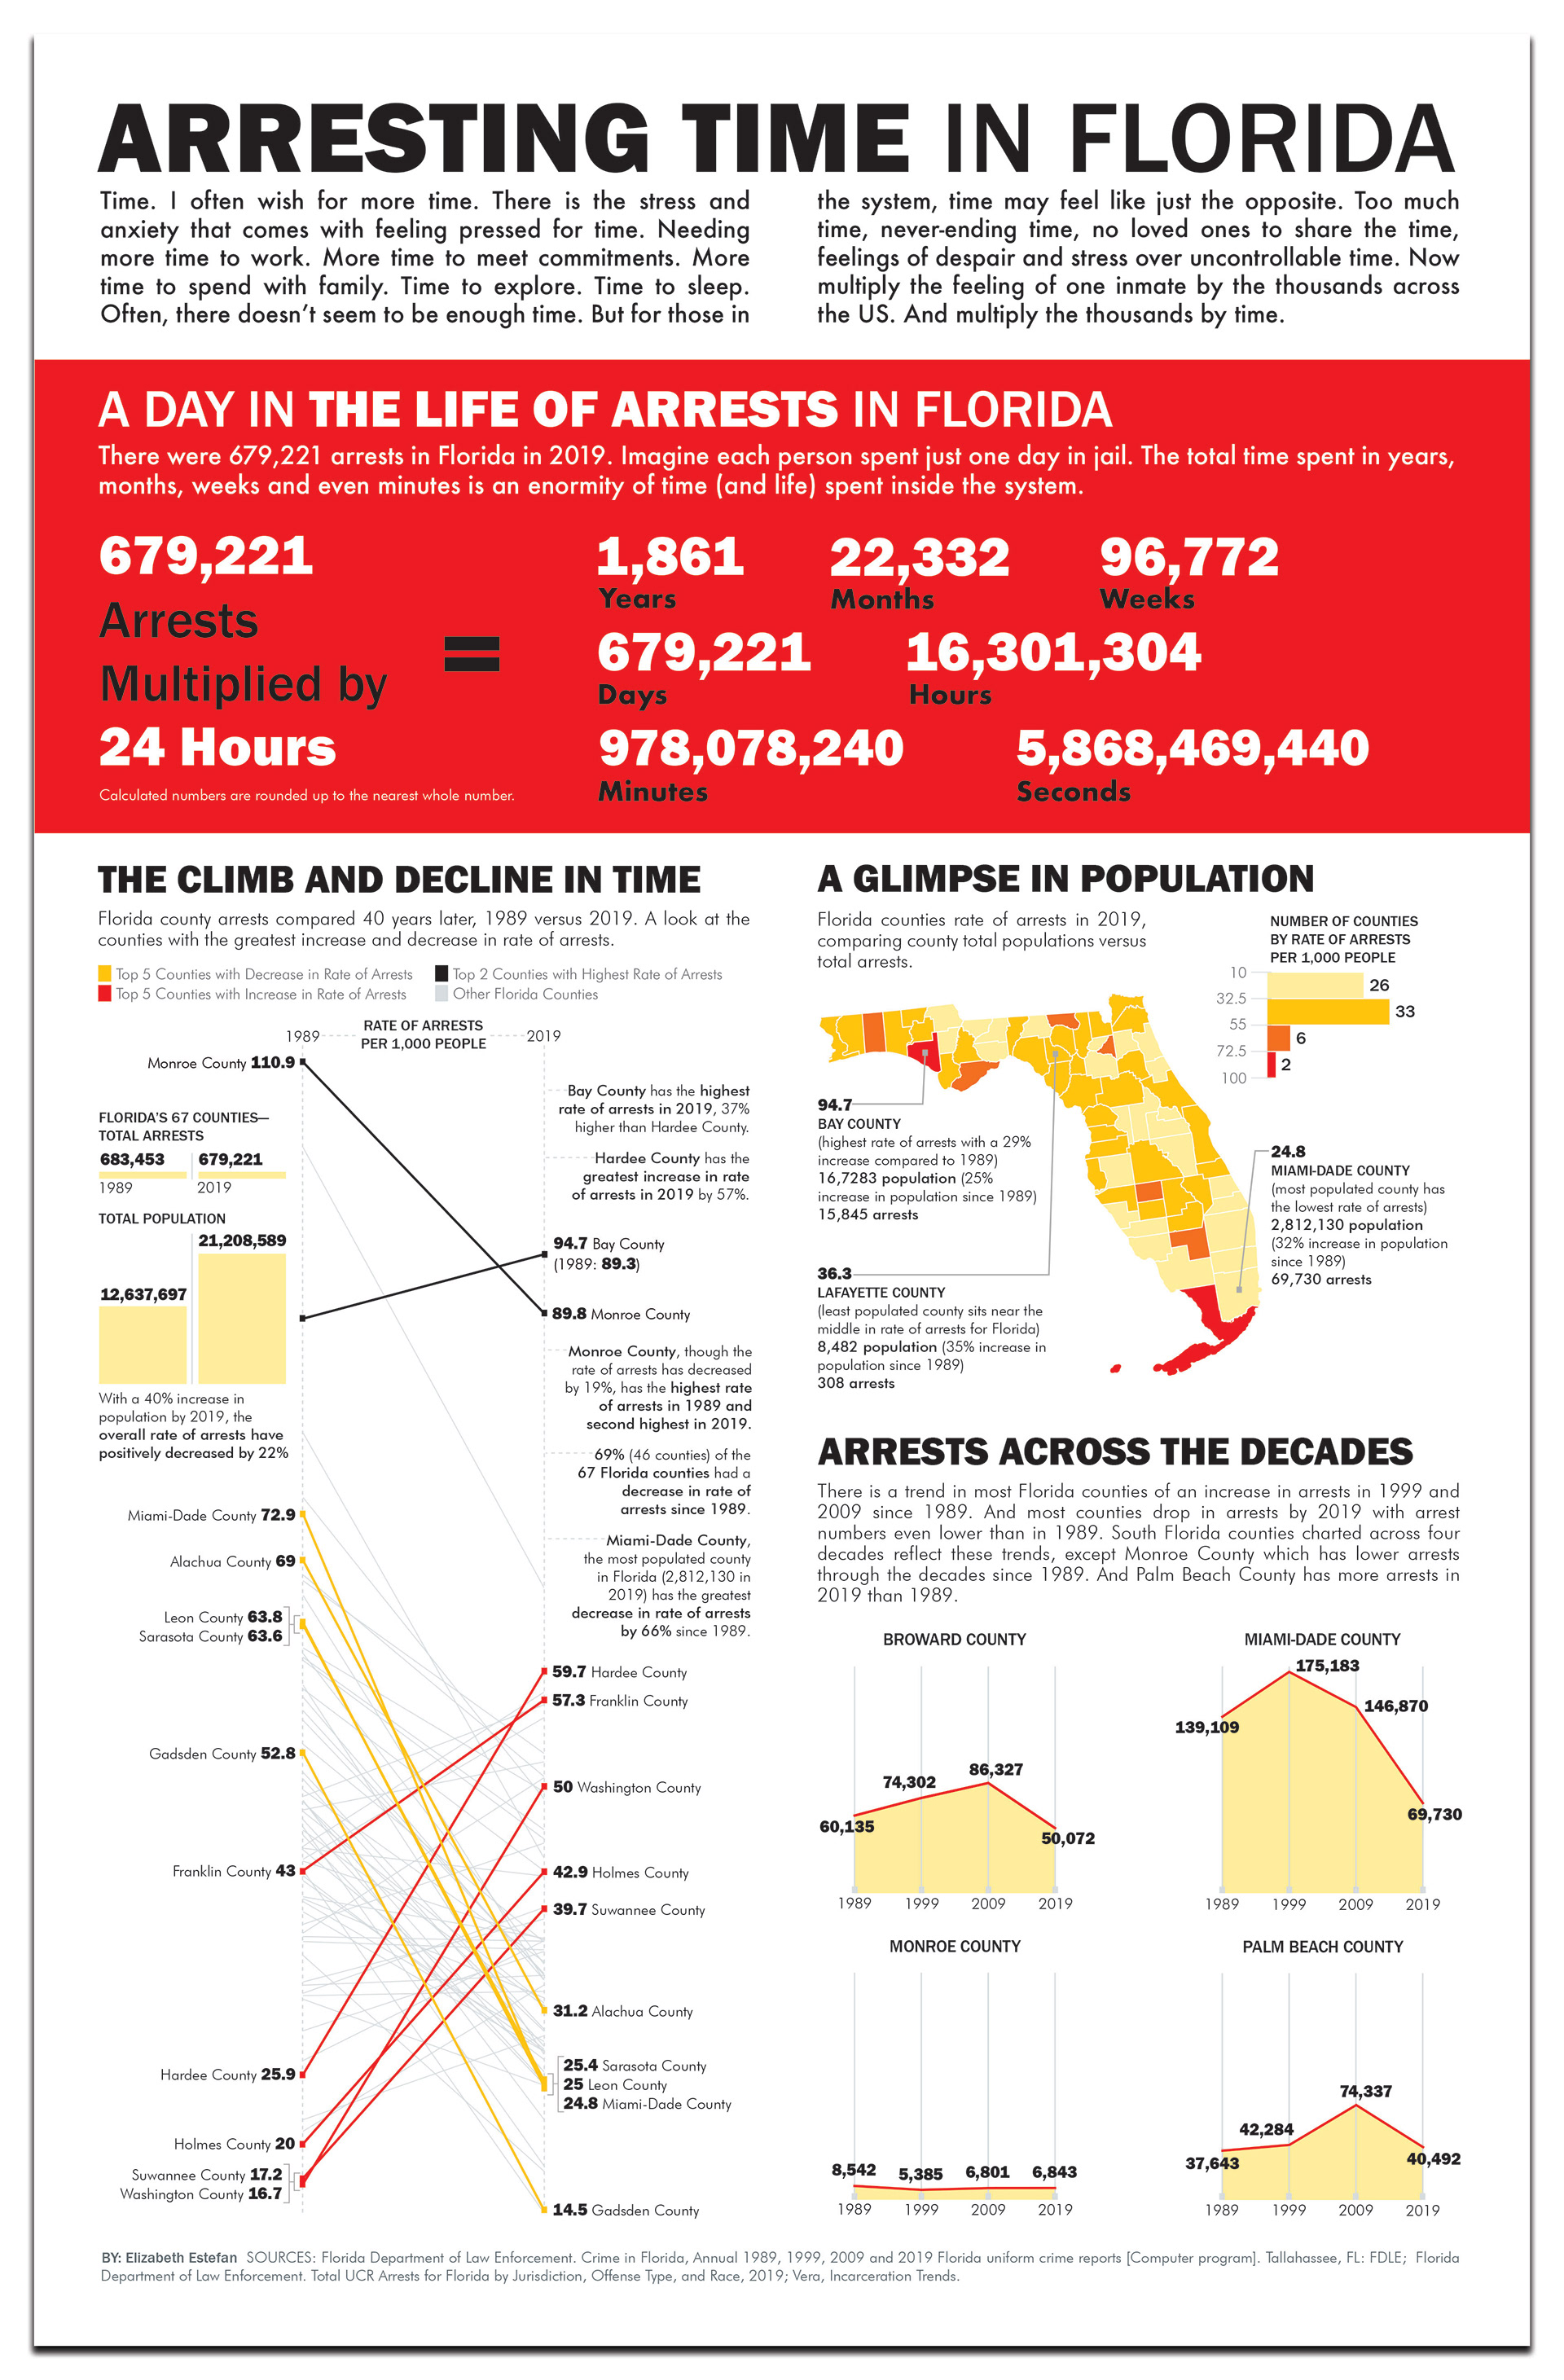
There can be a lot of stories in a single dataset, so many that I found myself a little overwhelmed by all the possibilities. To help with the challenge, I chose to narrowed my focus to Florida arrests. I ultimately compiled datasets from several to obtain information from various years across counties. Data sources include Florida Department of Law Enforcement. Crime in Florida, Annual 1989, 1999, 2009 and 2019 Florida uniform crime reports [Computer program]. Tallahassee, FL: FDLE; Florida Department of Law Enforcement. Total UCR Arrests for Florida by Jurisdiction, Offense Type, and Race, 2019; and Vera, Incarceration Trends.
The Proposal
I made my proposal of time and the charts I planned to use to show the volume of arrests over time and volume of time that equated. I proposed the following charts.
—Slopegraph to compare change over time. Increasing volume of arrests by county 1970 vs 2018/2019. Encoding: line weight and color hue.
—Choropleth Map of Florida arrest rates vs population by county to show volume, 2019. Encoding: color hue.
—Stacked Bar Graph to show arrest comparisons between South Florida counties (Miami-Dade, Broward, Palm Beach and Monroe counties) 1989, 1999, 2009, 2019. Encoding: Bar thickness, length and color hue.
—Exact Values to show grandness of time. Total number of arrests in one day multiplied by 24 hours and total number of years, months, weeks days, hours, minutes and seconds it equates.
Design Drafts and Critiques
For the assignment, we were tasked to create both a print Info Graphic 11" x 17" and a companion mobile version.
For the proposal design draft, I spent quite a lot of time creating my sketch in Illustrator to show as closely as possible my intended layout. I wanted to provide approximate proportion and placement and be as detailed as possible. This proved to be helpful with the following draft versions.

Design drafts: (L to R) Proposal sketch, version 1 sketch, version 2 sketch, revised final print and mobile versions.
The Critiques
I was given the green light to proceed with the story of arrests and time, and initial recommendations were provided. “Don’t bury the lead.” Start with the focus, the exact values in this case, rather than leading up to it and leaving it at the end. Then follow it with the supporting charts and graphs. Replace the stacked bar graph with a series of line graphs to better show comparison. And in the written proposal, include a project timeline.
Through the critiques, a better understanding of rates versus percentages was learned. This made the biggest impact on the slopegraph. And the cloropleth map was revised to compare rates rather than showing totals. After getting to know the data better, I found it more useful to point out Florida counties with the highest and lowest arrest rates. And the series of line charts were visually bulked up while overall refined. Additionally, the critiques helped me streamline and polish details throughout for better storytelling.
Reflections
The Data
No single dataset had all the data I needed. So compiling of data from different datasets was necessary. But eventually I would find once I started creating the charts, that how the data is placed in a spreadsheet is a factor greater than I imagined. What data should be in the rows and what data in the columns? And some charts like data one way while others another. So I compiled, and again, and again. It is certainly a learning curve, and I am still on that curve. They say it’s all in the journey — live and learn. I expect with experience, the understanding of how to better compile the data will become easier.
How Did I Miss It?
Sometimes a small detail or two are overlooked, but it makes all the difference. Thank goodness for an outside perspective that brings you the aha moment that changes everything. The whole project took a sudden turn. I naively was calculating percentages, when all along so much should have been rates. Suddenly I had a whole new slopegraph, needing new analysis, resulting in new findings and annotations, and some new annotations for the choropleth map. And the results were certainly more interesting.
And “The Rabbit Hole”
Then down the “rabbit hole” I went. From the reading of The New Yorker article to the initial data review to digging deep into the data, as I mentioned early, I became overwhelmed. There were so many directions to go with the data, many leading to completely new stories and some just more ways and more information to share about the story of time that I was attempting to share.
(My mind ran with thoughts about time of life being stolen, warranted or not. These is just a glimpse of my “rabbit hole.” Is the business of mass incarceration so hungry for money that it is making arrests just to further fill pockets? Are peoples’ lives being seized to feed this greed? How many lives are being harmed? Are some of these arrests even necessary? Are there offenses that need to be tossed out, not adding to arrests and incarcerations? What does it amount to? How much life is taken? How many lives are halted? What does this time look like? And after circling, I land back on time. And then the circle would begin again.)