MFA in Interactive Media
Capstone 2022
Capstone 2022
Overview
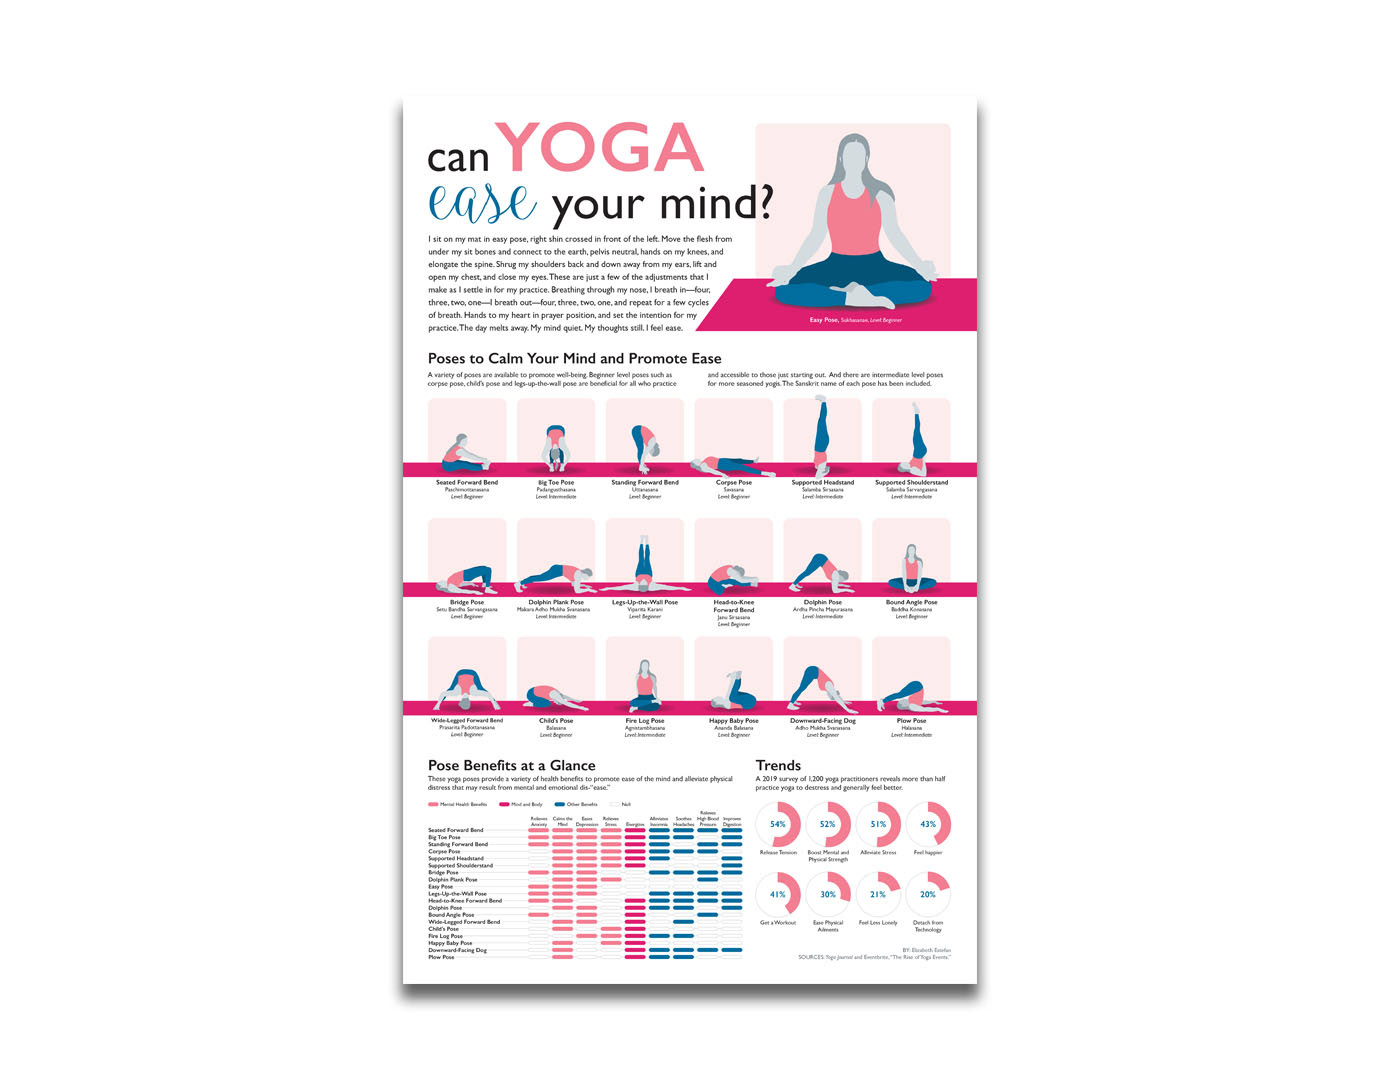
Yoga helps develop and deepen awareness—self-awareness of body and mind, and in life—awareness of our movements, our breath, our thoughts, our surroundings, our interactions and our intentions.
“The Shape of Yoga” is a data-driven physical visualization exploration with yoga as the conduit, a collective expression of a yoga practice built on tracking body and mind. The visualization aspires to provide a new perspective and awareness by seeing the cumulative of the journey.
What Is a Physical Visualization and
Why Use This Medium?
Why Use This Medium?
A physical visualization is a sculptural, dimensional form encoded with data and used to communicate and engage its audience. Its qualities invoke a new view beyond the page or a digital format. As a tangible form in one’s physical space, a physical visualization calls for attention, acting as a reminder. It promotes a new outlook.
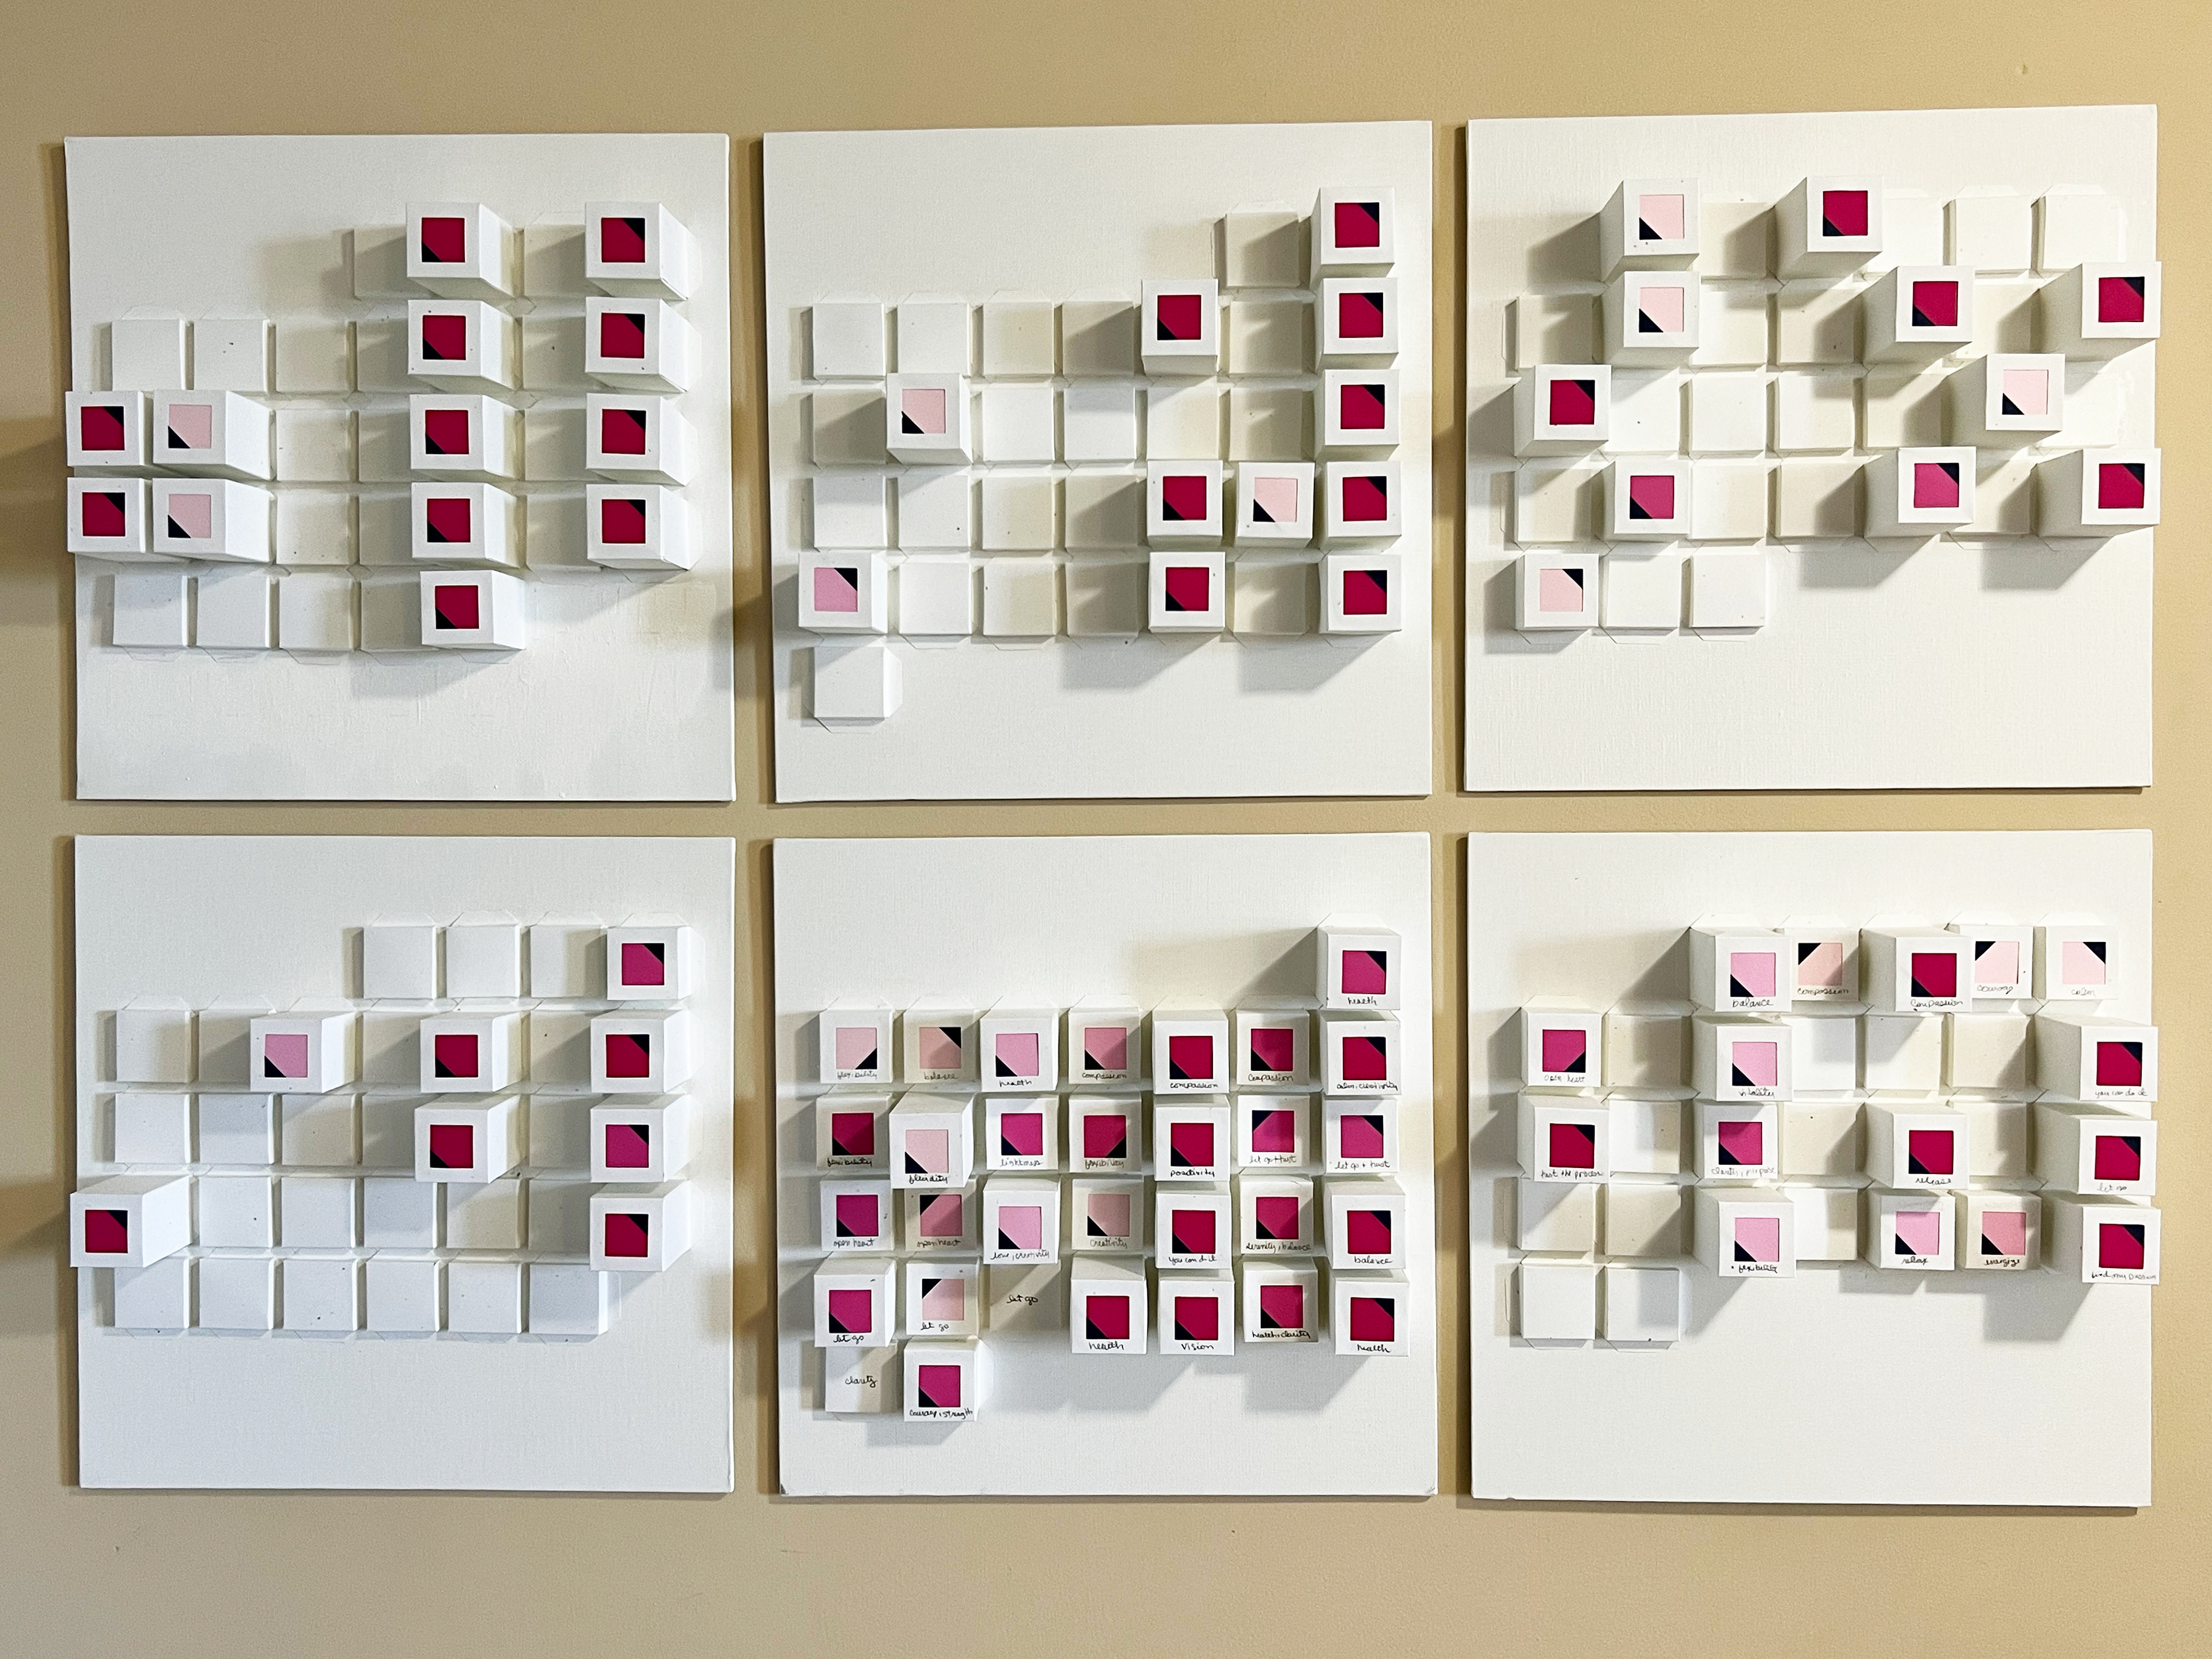
"The Shape of Yoga: September 2021 – February 2022"
Paper on Canvas, 36" x 24"
About the Data
I opted to use my personal data which was a welcomed discovery. The dataset is the merge of studio class signup data and Fitbit data. It spans 5 years of practice and approximately 600 entries. Included in the data are the day and date a practice on the mat took place which is the main data point, the class level or type of practice, the duration, and in more recent loggings the intentions set for practice which are qualities one wishes to cultivate for their practice on and off the mat.
About the Work
“The Shape of Yoga,” physical visualization reconstructs a yoga practice through its data across six months from September 2021 starting in the upper left corner through February 2022 in the lower right. It is akin to small multiples combined with dimensional bar chart-like forms in a non-traditional alignment. While individually each month provides some insight, together they tell a broader story.
The work as a whole spans 36” x 24” with each month in a calendar layout on 12x12 canvas. The tiles are formed of paper, each uniformly sized 1.25” square. The tiles overlay one another like a woven system. All days of each month are represented with a tile, starting on the first of the month and each week starting on Sunday.
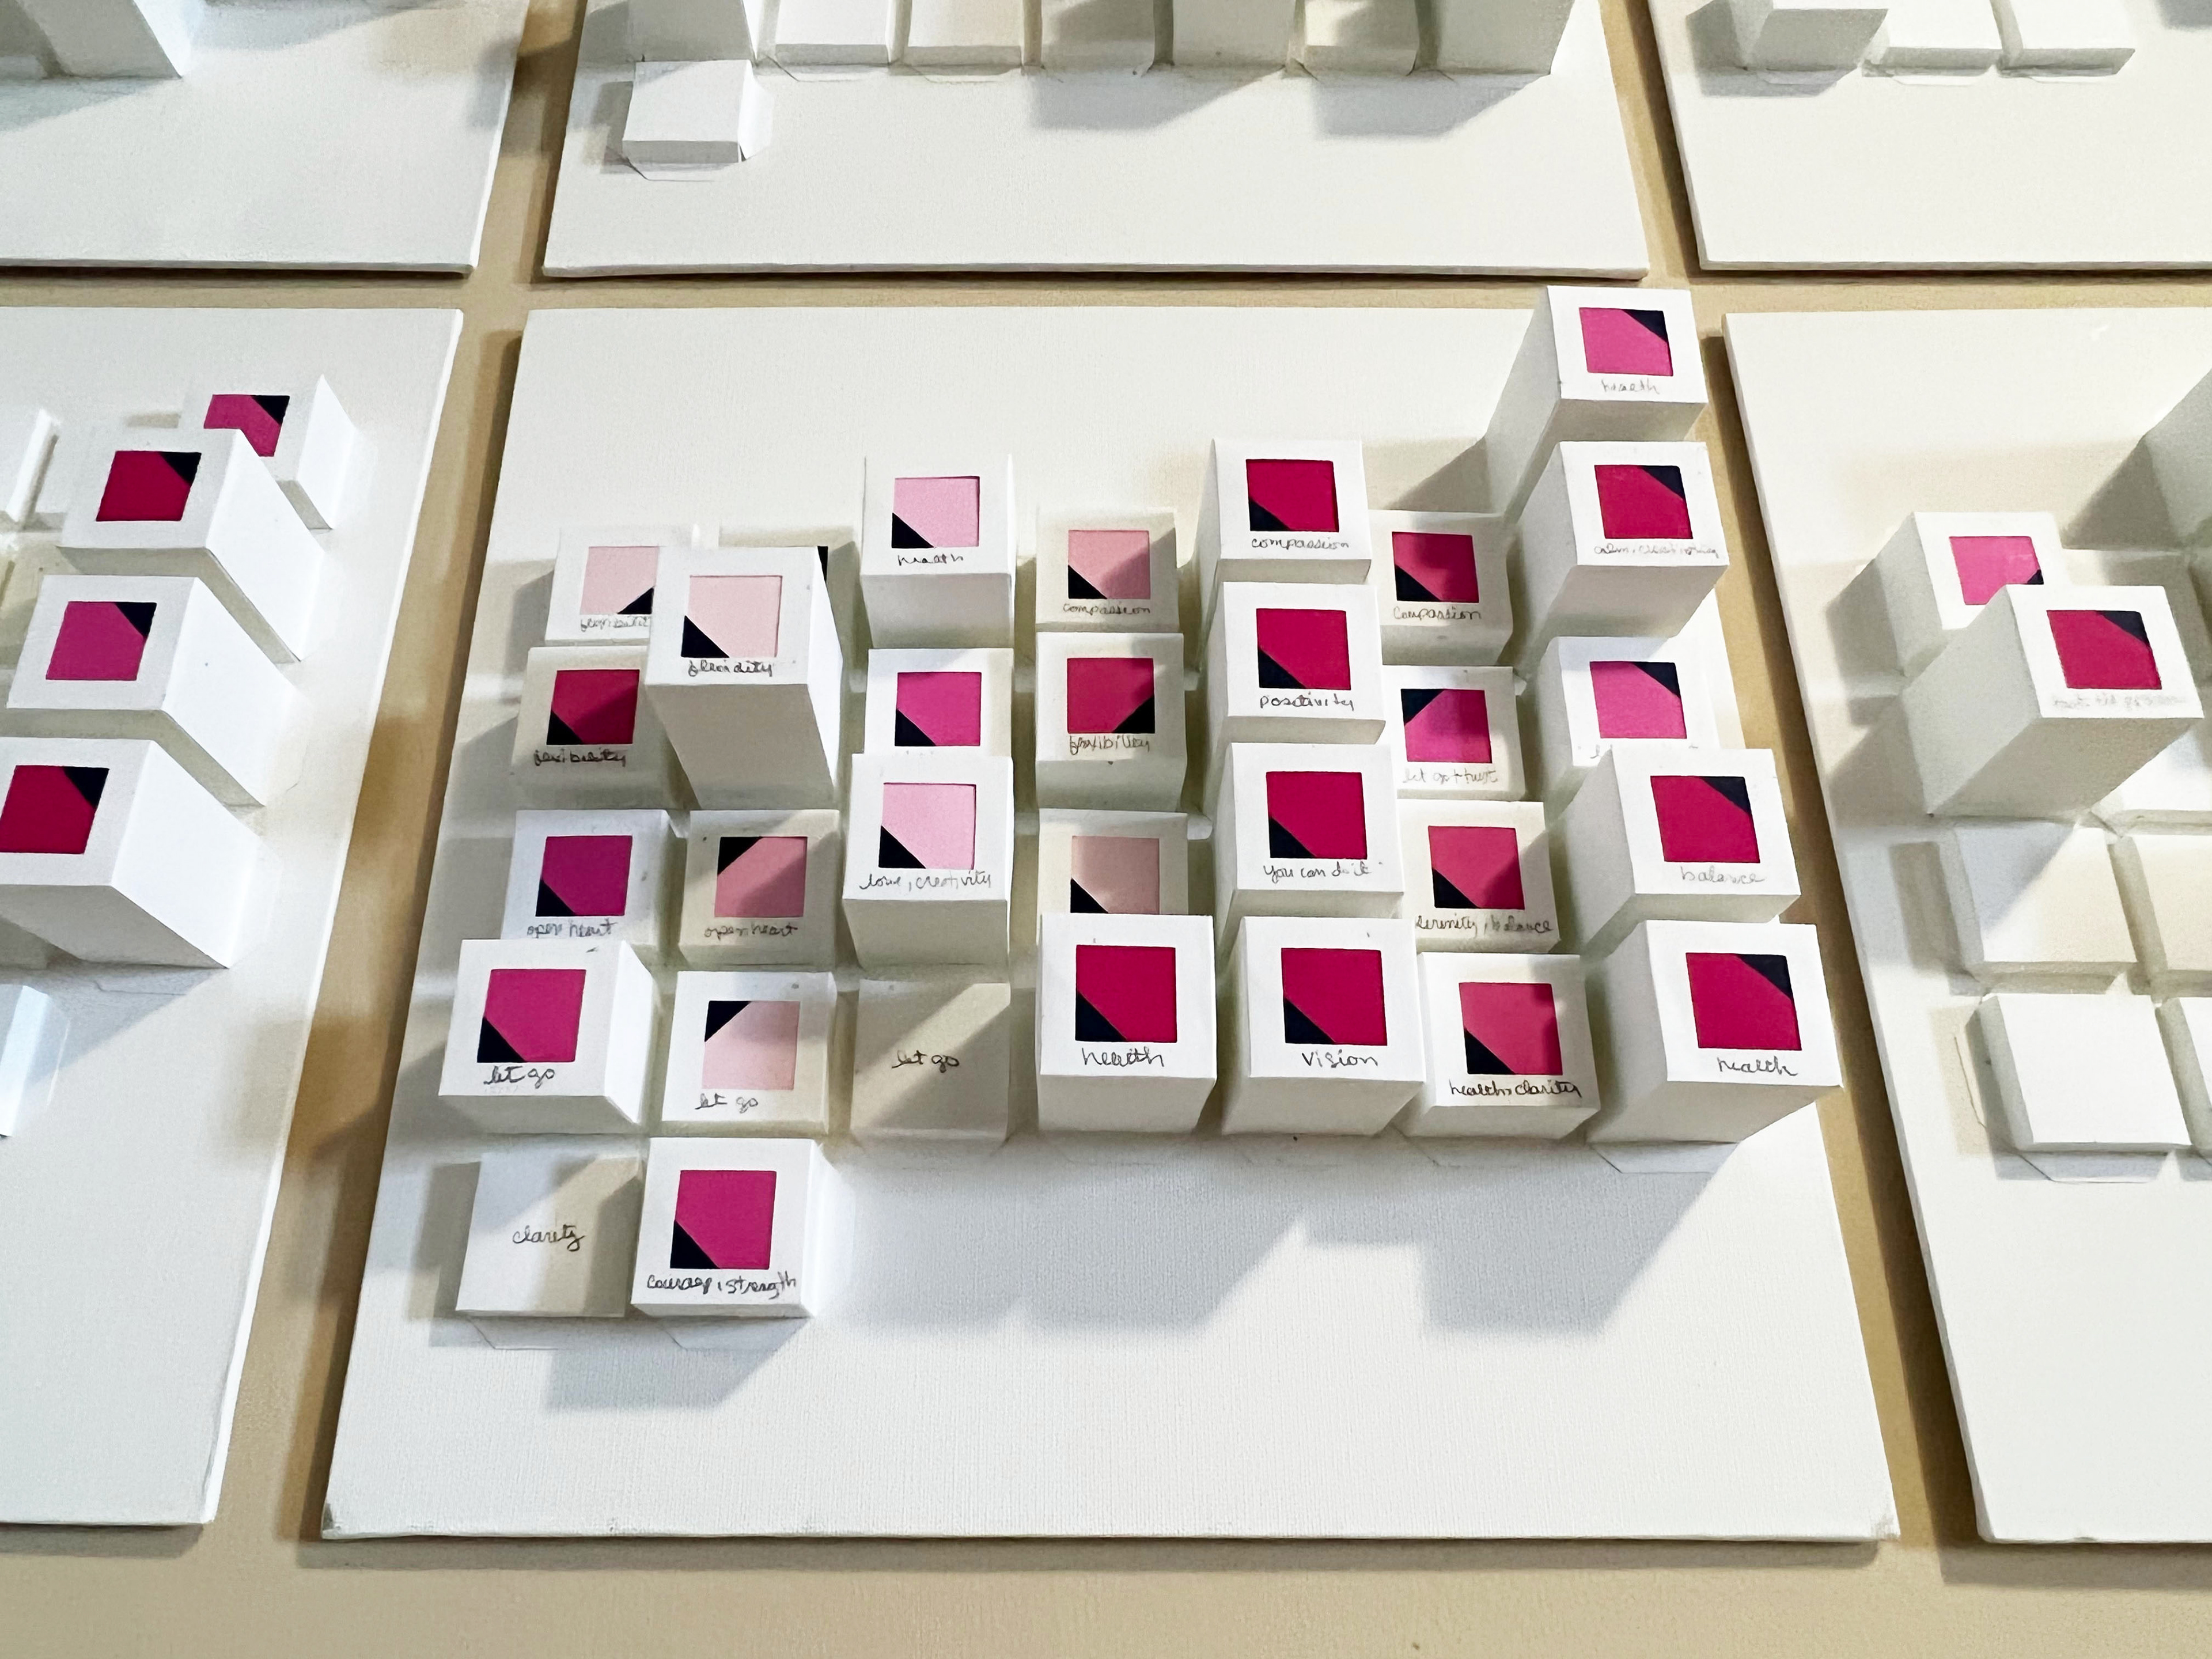
Detail—January 2022
Tiles with a color represent a day that a practice took place on the mat, color spanning from light pink to a deep magenta corresponding with the level or type of yoga practice from gentle to intermediate. The dark blue triangles represent the time of day the practice took place with placement similar to a clock, starting at the top right corner representing morning and moving clockwise to late night at the top left corner. The depth of each tile represents the duration of a practice ranging from a .25” for days off to 2.25” for long practices.
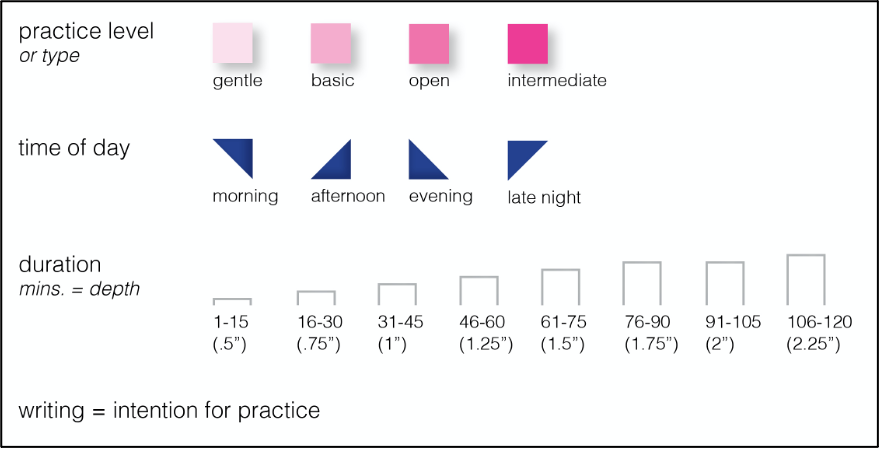
Legend
“The Shape of Yoga” explores an underused medium. The final work is achieved through traditional data visualization encoding, creating familiarity in the unfamiliar, and experimental and dimensional exploration. Through sharing the physical visualization, the work shows how tangible yet overlooked data impacts audiences and individuals by promoting insight and creating connection. The physical visualization provides a space of intimacy and awareness beyond the paper or the screen. Audiences related with the physical visualization's story through their own life experiences and gained a new perspective through interacting with the form.
To learn more about the project, read the weekly journal posts through its development at e-estefan.medium.com. For the latest posting visit "Capstone—Week 14."